Setup GlusterFS & Heketi with gk deploy

If you are interested in Kubernetes Storage, this series of articles is for you. In this part, I will explain how to up and run GlusterFS…
If you are interested in Kubernetes Storage, this series of articles is for you. In this part, I will explain how to up and run GlusterFS…

So i’ve spent actual days trying to get Gluster to automount using NixOS, i’ve tried most every combination and it came down to something…
For a while now, Ceph has supported Prometheus as it's native monitoring platform. In fact, since the Ceph Octopus release, Prometheus is the core component of the monitoring stack that the integrated installer deploys!
Normally, to realise the value from the data, you'd expect to visualise a Ceph cluster's state and performance through Grafana. Actually, the ceph-dashboard folks have done a great job integrating Grafana dashboards directly into the native Ceph UI.
However, not every Ceph user is a GUI user - which got me thinking. Ceph exposes state and performance data over regular http, as does Prometheus...which made me wonder how this "free" data could be used in the context of the CLI. This is where the idea behind cmon came from.
cmon is a simple tool; it doesn't use a ceph client and it doesn't introduce any new ceph code. It just consumes the data that mgr/prometheus and the Prometheus server provide. As long as you can see these HTTP endpoints - you're good to go.
There's a couple of collateral benefits too.
These are the main features that cmon offers;
The easiest way to take cmon for a testdrive is to grab the container, and define an alias to run it like this
docker pull pcuzner/cmon:latest
alias cmon="podman run --interactive --tty --net=host -e TERM \
-e CEPH_URL=http://192.168.122.92:9283/metrics \
-e PROMETHEUS_URL=http://192.168.122.92:9095 \
 --entrypoint='/cmon.py' docker.io/pcuzner/cmon:latest"
Don't forget to change the CEPH_URL and PROMETHEUS_URL parameters to match your environment.
As long as your URLs are good, just run your new cmon command! Once the tool is launched you'll see the core panels, showing inventory, capacity and health. The display gets refreshed every 15 seconds (there's a countdown indicator in the bottom right corner). Pressing 'h', overlays the help page on the display which tells you about the command keys to use to toggle on/off the optional panels and some further information relating to how the UI presents the data.
You could even create multiple aliases pointing to different Ceph clusters, and since the optional panels are parameters to cmon, you could tailor the displays to the clusters role...RGW or rbd for example.
If you're a Ceph user, and prefer to use the CLI, maybe give this tool a try - it could be useful addition to your 'toolbox'. If it is, let me know with a comment, or a star on github.
The project can be found on github: https://github.com/pcuzner/cmon
In this story, I would be going over how to create a xfs brick to be used by your volume.
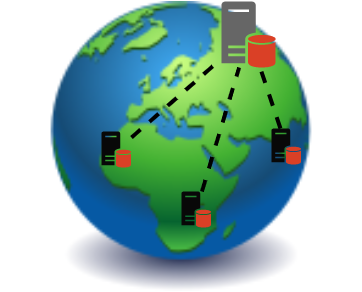
In the last blog, we went through the basics of Geo-replication and its different deployment services. In this blog, we will be going…
In the last blog, we went through the basics of Geo-replication and its different deployment services. In this blog, we will be going…
1. 安装glusterfs和heketi